








In July 2026, Microsoft added as many as six Copilot features to Excel, and I am not even considering the third-party integrations. Now, there’s another one coming, and it’s called Copilot Canvas, which might actually be useful. By the looks of things, you’ll be able to turn workbook data into interactive dashboards using Copilot.
One of the products where Copilot could be genuinely useful is Microsoft Excel. If you’ve never used Excel and you suddenly open a complex spreadsheet with dozens of sheets connected to each other, let’s say a financial model, you can’t possibly understand everything right away, and Copilot could actually explain it to you well.
I haven’t had much luck with Copilot in Excel, and if I have to use AI in a spreadsheet, I’d rather use Claude, which somehow does a better job than Microsoft. But that might not remain the case for too long, as Microsoft is clearly catching up.
Microsoft now says you’ll be able to create a full-fledged interactive Canvas using Copilot and keep it updated automatically.
“A Copilot-generated canvas that turns workbook data into a polished, interactive view of key visualizations, metrics, and insights. As workbook data changes, it automatically updates to reflect the latest information. Users can modify the canvas by chatting with Copilot,” the company noted in an updated roadmap.
Some of you might argue that it’s already possible to create dashboards, charts, insights, or trends using Copilot in Excel. It is, but with Canvas, Microsoft is taking that to the next level.
Right now, Copilot in Excel lets you create templates from scratch with a prompt and even build complex dashboards, as long as you have the data. You can also use Copilot to identify trends and outliers, create PivotTables and charts, edit existing charts, and pull information from the internet with proper attributions.
With the new Copilot Canvas, all of that can be brought together into an interactive dashboard-like view with your important charts, metrics, and insights.
The Canvas does not create a static AI-generated summary, which isn’t really useful. Instead, it stays connected to the workbook, and Copilot will automatically update the dashboard when the underlying data changes, either manually or when it’s fetched from another source.
This feature will begin rolling out in the coming weeks, and most of you should see it by early October.
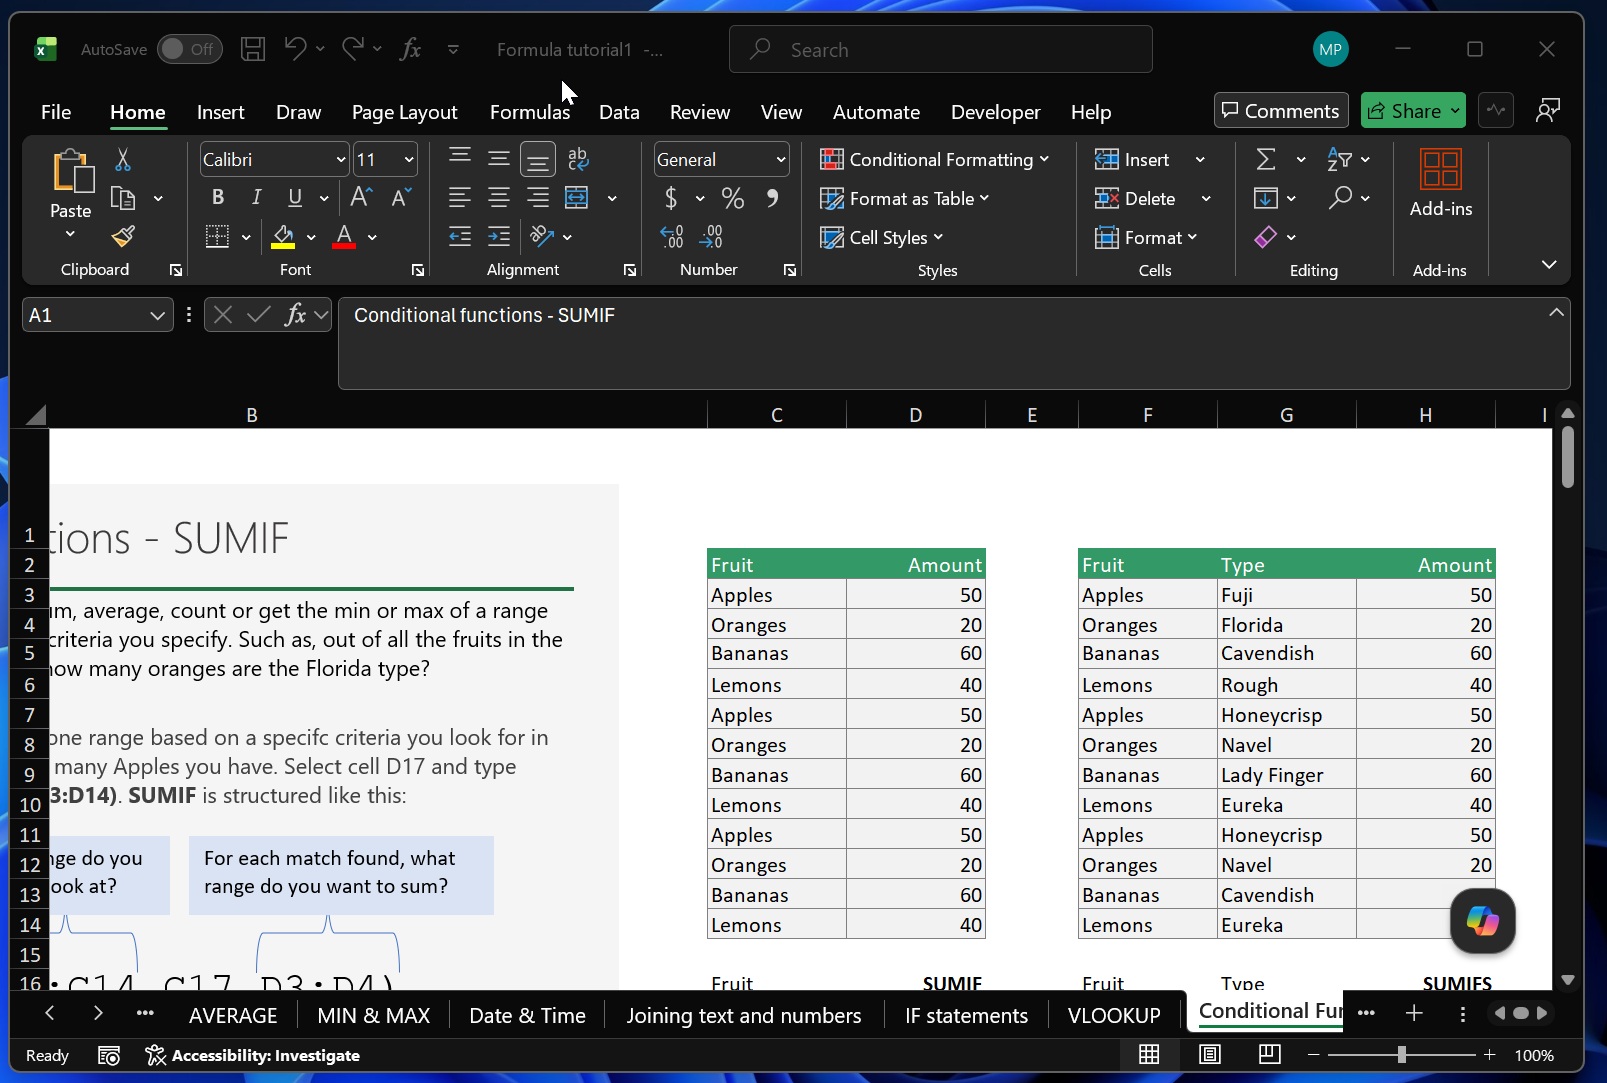
Microsoft keeps adding Copilot features to Excel for Windows 11
One of the most controversial changes to Office apps was the addition of a floating Copilot button, but that was ultimately made optional, and AI moved to the ribbon.
Since then, Microsoft has focused more on making the existing Copilot integration useful. One recent addition is “inline citations,” which provides deeper source links so you can validate Copilot’s responses. Here’s a screenshot showing off the citation in Copilot’s responses:
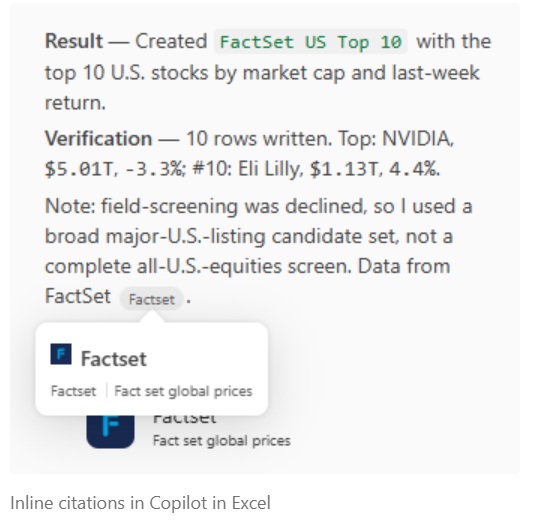
Citations are particularly useful because Copilot can make up stuff, and you can verify if it’s lying by referring to the cited sources.
Another feature that recently made its way to Copilot in Excel is a “theme design” skill, where Microsoft applies harmonized color palettes and structured layouts to raw data for a more polished look.
Speaking of Copilot skills, the August 2026 update also added a “change history skill,” which shows how a workbook has evolved over time:
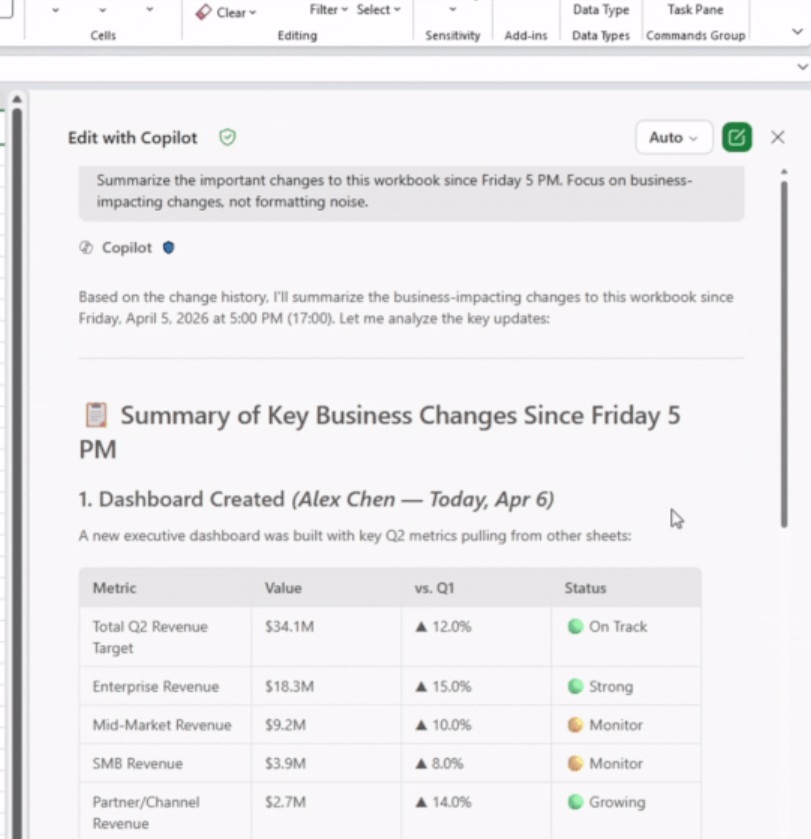
It’s similar to Revisions in Word, but in this case, since it’s built around AI, Copilot can summarize recent changes, so you can find out who made edits in a shared workbook and what changes were made by AI.
For example, you can ask Copilot what all the business-impacting changes were made to the workbook since Friday, and based on the change history, Copilot will summarize/answer directly. You no longer have to read the history and figure out what changed.
Third, Excel in Copilot has added a skill called “chart-design,” which lets you edit your existing charts and improve how they look or create your own. You can prompt the “chart-design” skill in Copilot to add items like axis titles, legends, and other elements that you’d otherwise manually do.
Where to enable these skills in Copilot for Excel?
If you don’t see the changes I highlighted above, particularly the skills, you need to make sure it’s actually enabled. In Excel, open Copilot, click the three dots/overlay menu, and select Manage Skills.
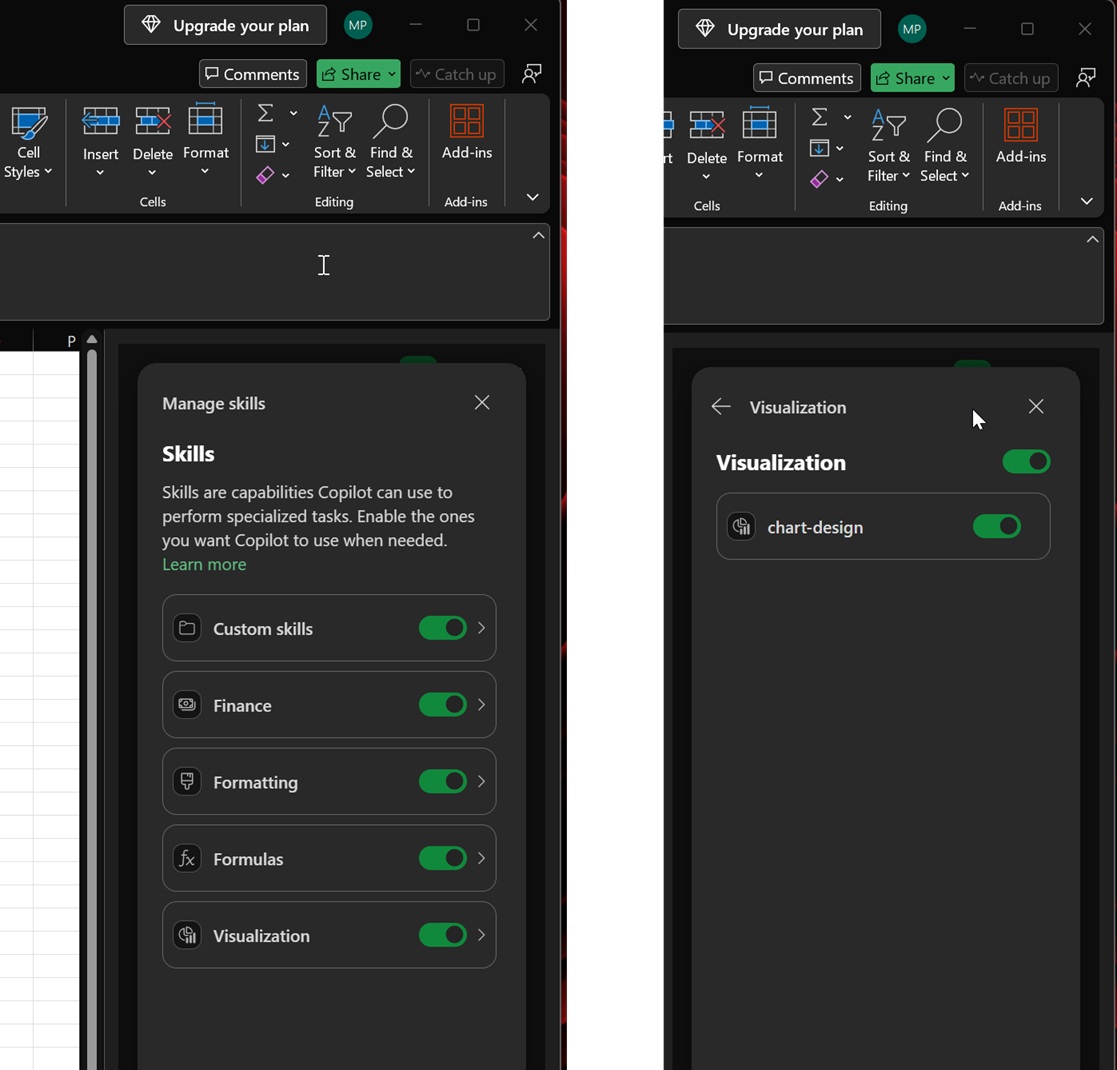
If you want to try the chart-design skill I just mentioned, open Visualization and make sure the chart-design skill is toggled on. Then, you can type @chart-design in Copilot and prompt your request.
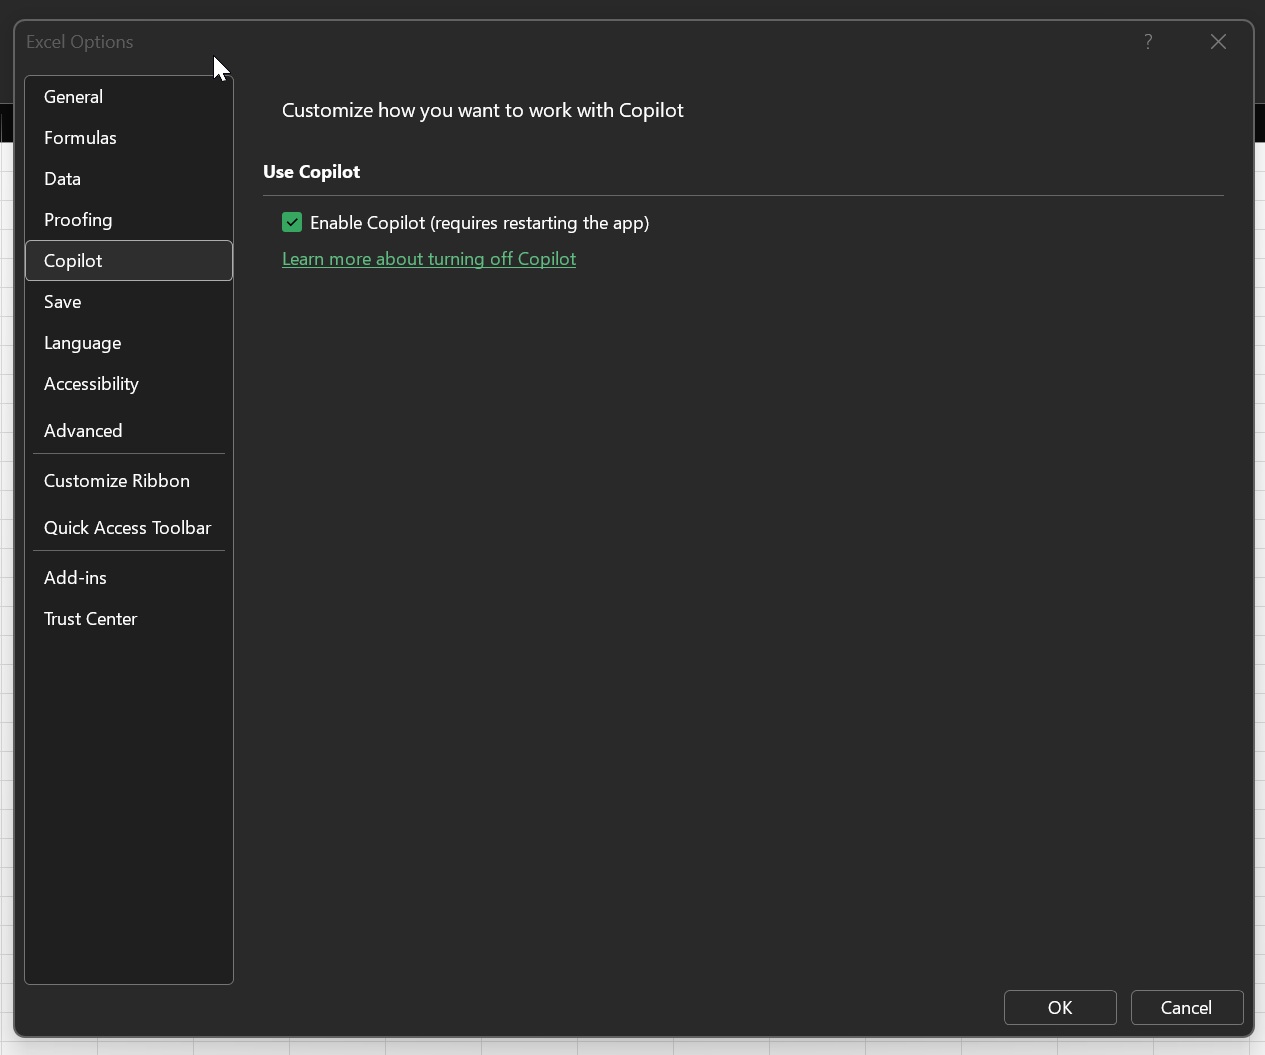
Copilot skills in Excel are useful, and I recommend giving them a try, but if you simply hate Copilot, you can disable it from File (top left) > Options (bottom left) > Excel Options > Copilot, and toggle it off (requires a restart).